1. What Is batplot?
batplot is a lightweight, open-source Python command-line interface (CLI) tool designed for rapid, publication-quality visualization of battery and materials characterization data. It reads raw instrument output files directly and produces fully styled, interactive figures from a single terminal command, with no scripting required.
Developed by a battery materials research group, batplot was born out of genuine visualization needs for 1D (XY) plots, electrochemical cycling, operando / in situ 2D contour plots, and column histograms, all under a customized interactive styling interface.
Wether you use Python or commercial softwares such as Origin for your plotting, batplot can speed up the data visualization process and help you shift effort to scientific interpretation.
Key capabilities:
- Zero scripting required. Every workflow runs from a single terminal command.
- Interactive menus: live, code-free customization of colors, geometries, spines, cycles and many more.
- Session save: save incomplete figure projects and reload them later.
- Style export: export visual configuration files.
- Batch processing: apply a style file to every matching file in a folder (
--all), or convert/export XRD axes in bulk (--convert).
Supported Data Types
batplot handles all major data types encountered in modern battery materials research:
| Data category | Supported formats |
|---|---|
| XRD / PDF / XAS | .xye, .xy, .qye, .dat, .csv, .txt, .brml (Bruker), .raw (Bruker), .gr, .nor |
| Crystallography | .cif |
| Electrochemistry (Neware) | .csv / .xlsx (GC, dQdV, CPC, EPC) |
| Electrochemistry (Biologic) | .mpt (GC, CV, CPC, EPC) |
| Histogram / tabular columns | .csv, .txt (one numeric column) |
| Generic two-column data | Any text/Excel file |
Interactive plotting modes
batplot has four primary interactive modes. Each is launched with a short command; batplot reads the files and applies sensible defaults:
- 1D / XY mode: plot 2-column data. Optimized for XRD with Q / 2θ conversion and CIF tick overlays, but also supports other text/Excel data files.
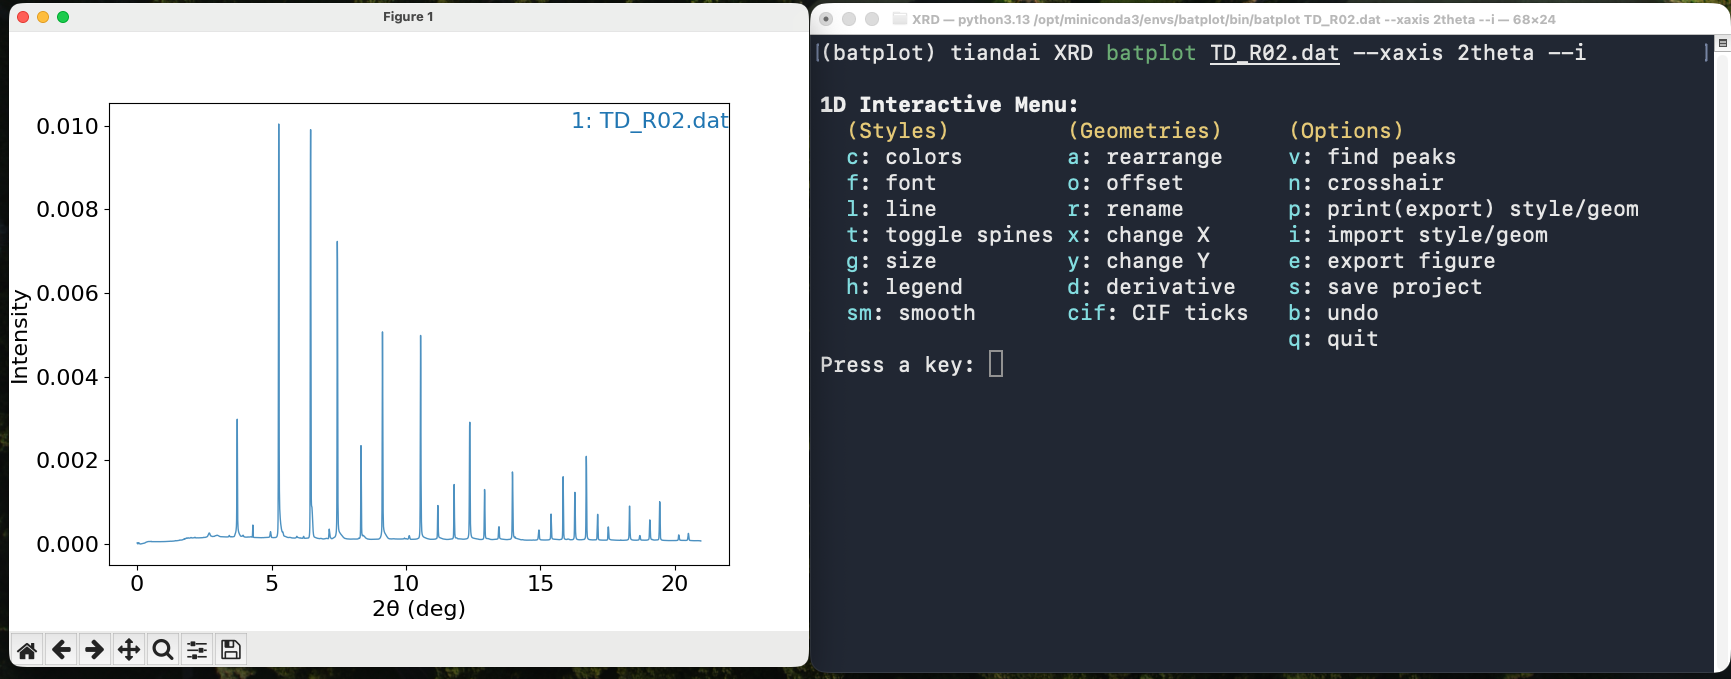
Figure 1: 1D mode
- Electrochemistry (EC) Mode: galvanostatic cycling (GC), cyclic voltammetry (CV), differential capacity (dQ/dV), and capacity/energy-per-cycle (CPC/EPC) plots from Biologic and Neware output files.
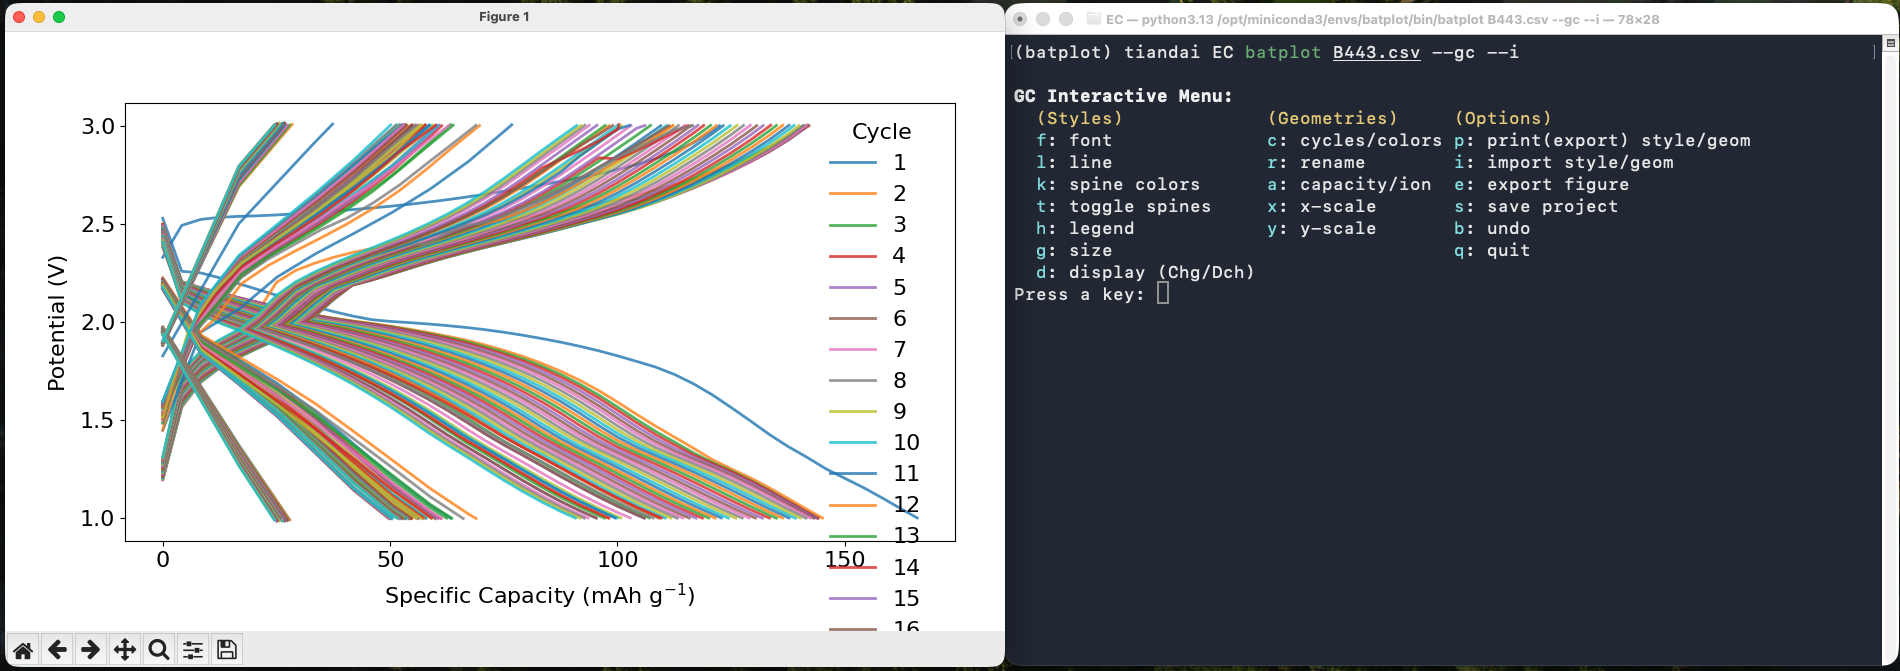
Figure 2: EC (GC) mode
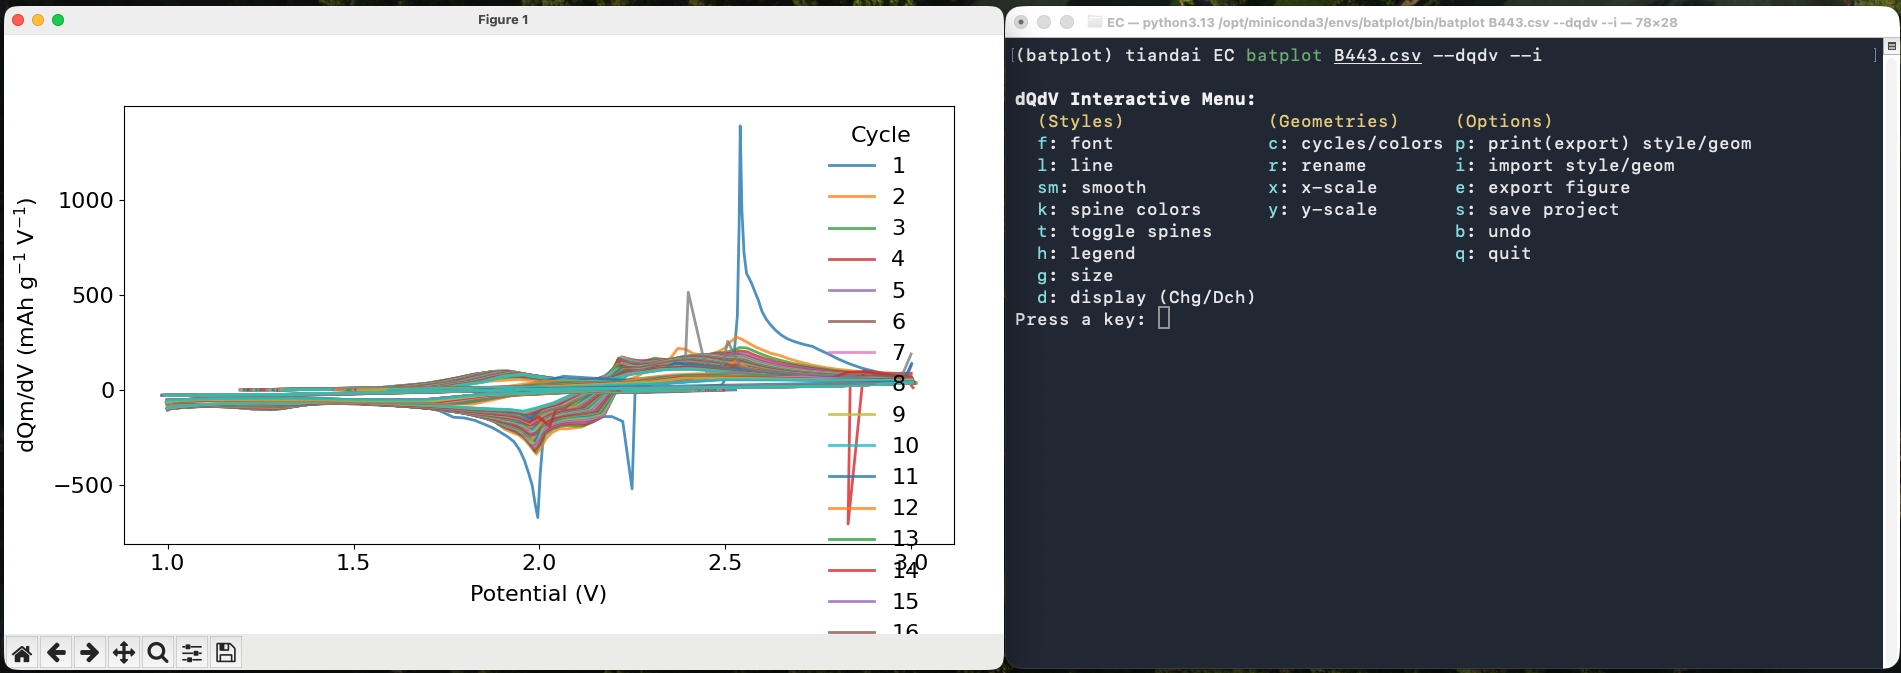
Figure 3: EC (dQ/dV) mode
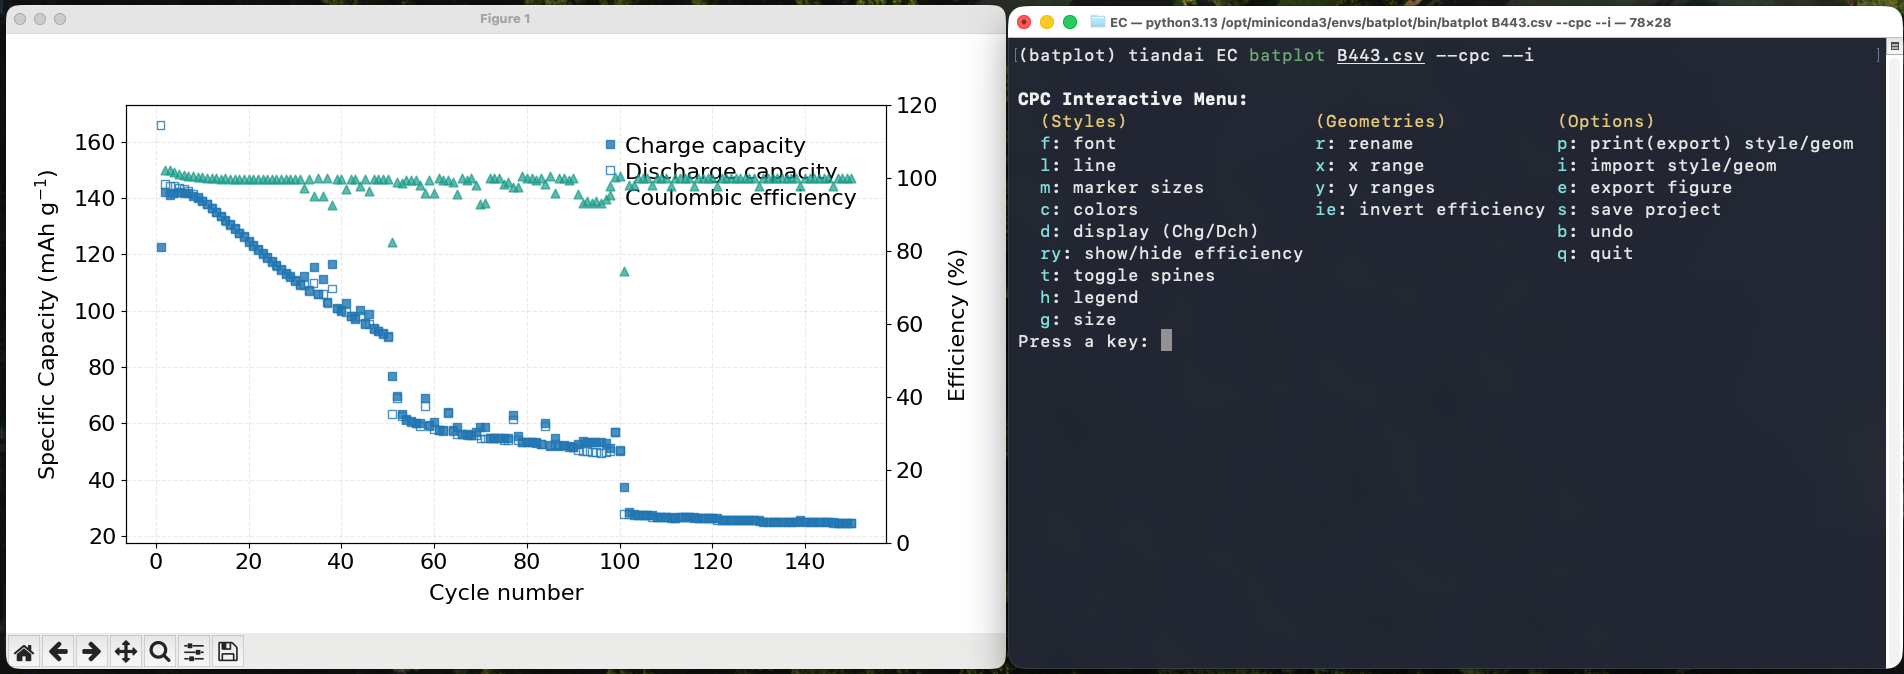
Figure 4: EC (CPC) mode
- Operando/contour mode: assembles a folder of sequential files into a 2D contour map and can plot electrochemical data as a synchronized side panel (if available).
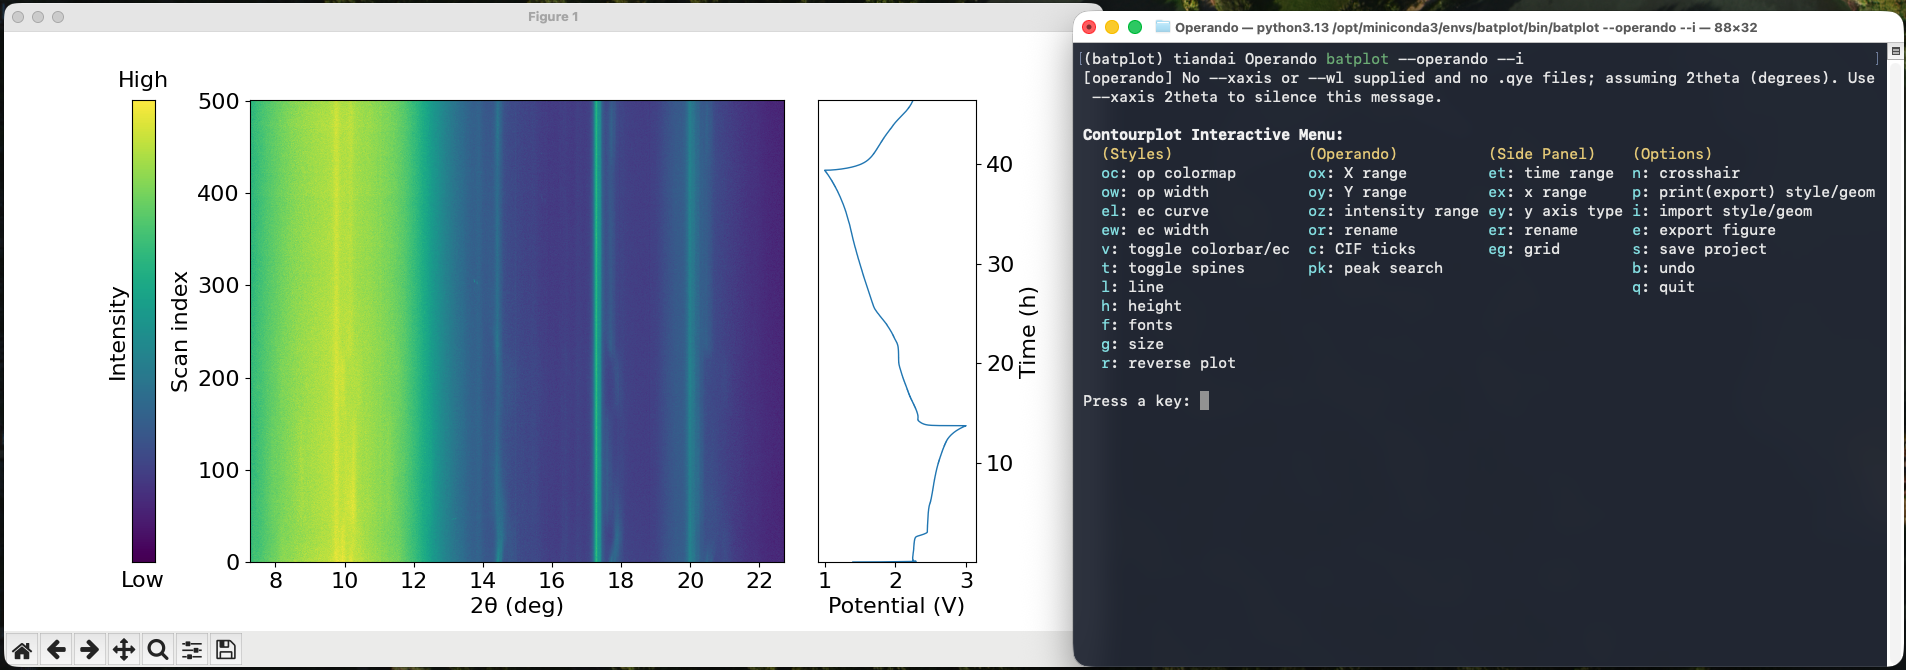
Figure 5: Operando mode
- Histogram mode: plot a single numeric column (for example particle-size lists) as a bar histogram, with an interactive wizard and menu. See Histogram.