7. Operando Mode
Operando mode is the most distinctive feature of batplot. When pointed at a folder containing sequential XRD, PDF, or XAS scans (or any text based data files) collected during an electrochemical experiment, it automatically assembles them into a 2D contour map. When a Biologic .mpt file is detected in the same folder, it also renders the GC curve as a synchronized side panel.
This dual-panel figure, correlating structural evolution with the electrochemical state of the cell, is the primary visualization type in operando battery research and previously required dedicated, per-experiment scripting to produce. Now, batplot generates it from raw files in a single command.
Note
Navigate into (or specify) the folder containing the scan files before running the command. The .mpt file (if present) must be in the same folder as the scan files.
Basic Operando Launch
Navigate to the data folder and run:
Or with explicit folder path:
batplot detects supported scan files (.xye, .qye, .xy, .dat, …), assembles them into a contour with natural sorting, and — if an .mpt or DataLogger CSV is present — places the electrochemical trace in a synchronized side panel.
Demo operando wavelength
Tutorial Operando scans are TD_S0034_* from a Cu source — use --wl 1.54. (Synchrotron TD_R* patterns use 0.259 Å.)
Wavelength Conversion in Operando Mode
Convert data from 2θ to Q:
Cu lab operando (demo TD_S0034_*)
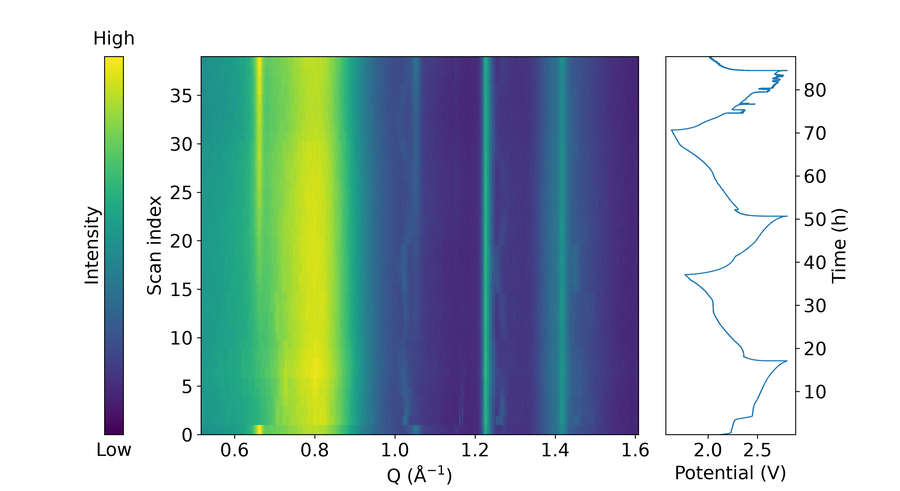
Figure: Operando contour (--operando --wl 1.54; subset of demo scans)
synchrotron operando (use when your scans are TD_R*-style / λ = 0.259 Å)
CIF Phase Tick Marks on the Contour
CIF files can be appended to overlay Bragg reflection tick marks directly on the operando contour panel. The same wavelength conversion logic used in 1D mode applies here.
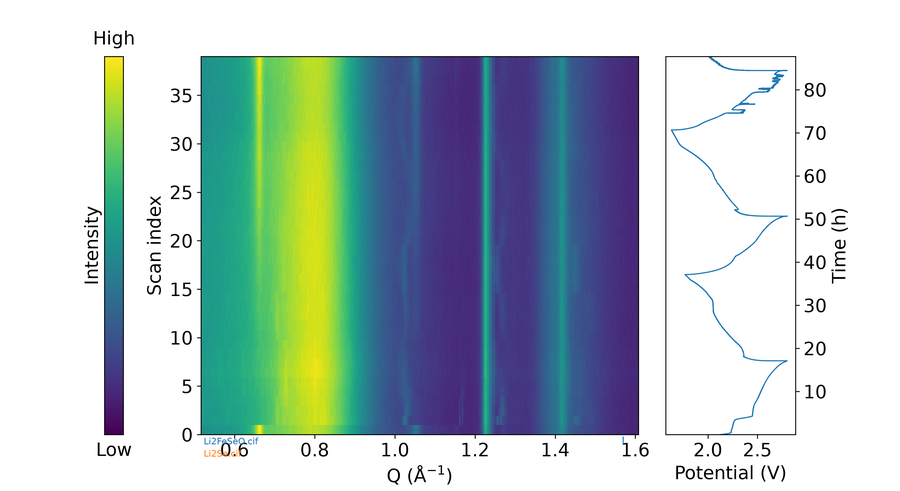
Figure: Operando + CIF (Li2FeSeO + Li2Se, --wl 1.54)
Derivative Contour
Plot the first or second derivative dy/dx of each scan as the contour, useful for XAS:
Bruker .brml and EC side panel
Place multi-scan Bruker .brml files (for example …_cyc1.brml, …_cyc2.brml) in a folder. Use --wl when converting to Q:
The EC side panel can use a Biologic .mpt or a Biologic DataLogger CSV (*--DataLogger.csv) in the same folder (time is concatenated across cycles when applicable).
Averaging and column selection
--readcolc: columns for the contour scans--readcols: columns for the side-panel EC file
Interactive menu — Operando (contour)
Clickable interactive menu
Add --operando --i. Menu title: Contourplot Interactive Menu.
| Layout | Columns |
|---|---|
| With EC side panel | Styles | Operando | Side Panel | Options |
| Contour only | Styles | Operando | Options (no el, no Side Panel) |
Key oc — Operando colormap
Changes the false-color map of the contour (intensity → color).
| What you type | What it does | Example |
|---|---|---|
| A number from the printed list | Apply that numbered colormap from the printed list. | Type 3 to apply the third listed colormap. |
A name (e.g. viridis, inferno, coolwarm) |
Apply that matplotlib colormap if recognized. | Type viridis or inferno. |
q or blank (when allowed) |
Leave this submenu and return one level up (or to the main menu). | Type q. |
The colorbar updates with the map. Intensity limits are separate (oz).
Key el — EC curve style
Only when a side panel exists.
| Key | What it does | Example |
|---|---|---|
c |
Set the color of the EC side-panel curve. | Type c, then red or pick with e. |
l |
Set the EC curve linewidth. | Type l, then 2. |
s |
Open EC line style (solid / markers / dashed). | Type s, then ld or da. |
q |
Return to the main operando menu. | Type q. |
Inside s:
| Key | What it does | Example |
|---|---|---|
l |
Draw data as solid lines only (no markers). | Type l. |
ld |
Draw curves as a solid line with markers. | Type ld. |
d |
Draw markers only (no connecting line) for the selected curves. | Type d (or ld/dd siblings) to switch style, then q back. |
da |
Draw curves as dashed lines. | Type da. |
dd |
Draw curves as dashed lines with markers. | Type dd. |
q |
Return to the previous menu without further changes. | Type q. |
Key v — Visibility
With EC side panel:
| Key | What it does | Example |
|---|---|---|
1 |
Toggle colorbar visibility. | Type 1. |
2 |
Toggle the EC panel visibility. | Type 2. |
3 |
Toggle both colorbar and EC panel. | Type 3. |
4 |
Toggle colorbar label mode (High/Low vs normal numbers). | Type 4. |
5 |
Edit the colorbar label text. | Type 5, then Intensity (a.u.). |
m |
Move the colorbar / EC panel horizontal position. | Type m, then c or e, then a/d. |
q |
Return to the main operando menu. | Type q. |
Contour only (no EC): the prompt lists a shorter set (1 / 2 / 3 / m / q) for colorbar and labels.
Key t — Spines and ticks
Operando can style two panels. First choose which panel, then use the full WASD tools.
Step 0 — Choose a panel
| Key | What it does | Example |
|---|---|---|
o |
Select the operando / contour panel for styling. | Type o, then s2 to toggle bottom major ticks. |
e |
Select the electrochemistry side panel for styling. | Type e, then a4. |
Then use the same spine/tick system as other modes:
Spines are the four border lines of the axes box. Tick marks, tick numbers, and axis titles sit on those sides.
Press t, then type commands at the spine prompt. Most toggles are a side letter + number with no space (for example s2). You can put several codes on one line.
Step 1 — Pick a side (WASD)
| Key | What it does | Example |
|---|---|---|
w |
WASD top side of the axes box. | Type w5 to toggle the top axis title. |
a |
WASD left side of the axes box. | Type a4 to toggle left tick numbers. |
s |
WASD bottom side of the axes box. | Type s2 to toggle bottom major ticks. |
d |
WASD right side of the axes box. | Type d1 to toggle the right spine line. |
Step 2 — Pick what to show/hide on that side
| Number | What it does | Example |
|---|---|---|
1 |
Toggle the border spine line on the chosen side. | s1 toggles the bottom spine. |
2 |
Toggle major tick marks on the chosen side. | a2 toggles left major ticks. |
3 |
Toggle minor tick marks on the chosen side. | s3 toggles bottom minor ticks. |
4 |
Toggle tick number labels on the chosen side. | a4 hides or shows left numbers. |
5 |
Toggle the axis title on the chosen side. | w5 toggles the top title. |
Examples (copy these ideas)
| You type | What it does | Example |
|---|---|---|
s2 |
Toggle bottom major tick marks on the plot frame. | Type s2 once to hide bottom majors; type again to show them. |
w5 |
Toggle the top axis title visibility. | Type w5 to hide the top title if it overlaps the plot. |
a4 |
Toggle left-side tick number labels. | Type a4 to hide left numbers for a cleaner export. |
d1 |
Toggle the right spine (border) line. | Type d1 to remove the right border. |
s2 w5 a4 |
Apply several WASD toggles in one command (space-separated). | Type s2 w5 a4 to hide bottom majors, top title, and left numbers together. |
Blank line or q leaves a nested prompt; q on the spine prompt returns to the main interactive menu.
Extra commands (type the letter alone)
| Key | What it does | How to use it | Example |
|---|---|---|---|
i |
Flip tick marks to point into vs out of the plot. | Type i once; type again to flip back |
Type i once; type again to flip back. |
l |
Set major tick length (points). Minor length is set automatically to about 70% | Type l, then enter a positive number |
Type l, then 6. |
n |
Set spacing between major ticks. | Type n, then e.g. x 0.5, y 1, all 1, or x auto |
Type n, then x 0.5, all 1, or x auto. |
m |
Set how many minor ticks sit between majors. | Type m, then e.g. x 4 or all 0 (off) |
Type m, then x 4 or all 0 to disable. |
p |
Nudge axis titles away from the data. | See the next table | Type p, then w and use nudge keys. |
list |
Print the current spine/tick on/off state for every side. | Read the report, then continue | Type list. |
q |
Leave this submenu and return one level up (or to the main menu). | Back to the main interactive menu | Type q. |
Inside p — move axis titles
| Key | What it does | Example |
|---|---|---|
w |
WASD top side of the axes box. | Type w5 to toggle the top axis title. |
s |
WASD bottom side of the axes box. | Type s2 to toggle bottom major ticks. |
a |
WASD left side of the axes box. | Type a4 to toggle left tick numbers. |
d |
WASD right side of the axes box. | Type d1 to toggle the right spine line. |
r |
Reset all title-offset nudges back to the default positions. | Type r after overshooting with x 0.5 / y -0.3. |
q |
Leave this submenu and return one level up (or to the main menu). | Type q. |
Typical nudge keys after you pick a side: w/s/a/d to move, 0 to reset that title, q to go back.
Operando-specific notes
| Tip | What it does | Example |
|---|---|---|
| Contour-only figure | There is no e panel — you only style the contour. |
Type o (not e) then s2 for bottom ticks on the contour. |
| Colorbar / EC visibility | That is main-menu v, not t Use the matching single-key rows for full detail. |
Type one option from Colorbar / EC visibility, for example the first key listed. |
| Spine colors | Use main-menu k or c → s, not the t (ticks) menu. |
Type k, then a:black to color the left spine. |
Key k — Spine colors
| Step | What it does | Example |
|---|---|---|
| 1 | Choose which panel to style: o (contour) or e (EC side panel). |
Type o then continue with WASD keys. |
| 2 | Color that panel’s spines with w:color / a:color / s:color / d:color, or use e / u. |
After o, type a:#333333 or e to pick from screen. |
Key l — Line widths
Styles the frame and tick linewidths on the contour figure (not the EC curve — use el for that).
| What you do | Detail | Example |
|---|---|---|
Press l |
Opens prompts for contour frame and tick linewidths (not the EC curve). | Type l from the main menu. |
| Enter a positive number | Applies that linewidth to the prompted element. | Type 1.5 when asked for frame width. |
q / blank when allowed |
Leave without changing. | Type q or press Enter if blank is allowed. |
EC panel curve style is under el. Grid on the EC panel is eg.
Key f — Font
| Key | What it does | Example |
|---|---|---|
f |
Choose the font family (pick a list number or type a name). | Type f, then 2 or Helvetica. |
s |
Set the font size in points. | Type s, then 12. |
b |
Choose bold or normal font weight. | Type b, then bold. |
h |
Open text-highlight tools (colored box behind label text). | Type h, then t to turn highlight on. |
q |
Return to the previous menu without further changes. | Type q. |
Key g — Size / layout
Operando size is richer than 1D: you can change the whole figure and the relative panel widths/height.
| Key | What it does | Example |
|---|---|---|
c |
Whole figure (canvas) size in inches — enter width and height. | Type c, then 8 6. |
o |
Set the operando / contour panel width (inches). | Type o, then 5.5. |
e |
Set the EC side-panel width (inches), when that panel exists. | Type e, then 2.0. |
h |
Set the shared panel height (contour + colorbar + EC). | Type h, then 4.0. |
s |
Scale the whole layout by a factor (e.g. 1.2). |
Type s, then 1.2 to enlarge everything 20%. |
q |
Return to the main operando menu. | Type q. |
Older aliases ow / ew (and sometimes h typed from the old menu) still open this size menu.
(Older aliases h / ow / ew still open this size menu.)
Key r — Reverse plot
Reverses contour stacking immediately. No submenu.
Keys ox / oy / et / ex — Limits
| Key / input | What it does | Example |
|---|---|---|
min max |
Enter both limits as two numbers separated by a space. | 10 80 or 3.0 4.2. |
w |
Raise/step the upper axis limit. | Type w a few times, or enter a numeric max when prompted. |
s |
Lower/step the lower axis limit. | Type s a few times, or enter a numeric min when prompted. |
a |
Auto-scale this axis to the visible data. | Type a after zooming too far. |
q |
Return to the previous menu without further changes. | Type q. |
Key oz — Intensity scale
| Key | What it does | Example |
|---|---|---|
limit1 limit2 |
Set both intensity limits at once (either order). | Type 0 200 or 200 0. |
w |
Edit the upper intensity limit only. | Type w, then 150. |
s |
Edit the lower intensity limit only. | Type s, then 10. |
b |
Open a drag bar (RangeSlider) to adjust the intensity window interactively. | Type b, drag the handles, close the slider window. |
a |
Auto-fit intensity to the visible X/Y region. | Type a after zooming into a weak feature. |
q |
Return to the main operando menu. | Type q. |
Keys or / er — Rename
Use or to rename titles on the operando / contour panel. Use er to rename titles on the EC side panel (only when that panel exists). Both menus share the same subkeys:
| Key | What it does | Example |
|---|---|---|
x |
Set this panel’s X-axis title (contour X for or, EC X such as capacity for er). |
After or or er: type x, then Q (Å$^{-1})$ or Capacity (mAh g$^{-1}$). |
y |
Set this panel’s Y-axis title (scan/time on the contour, or potential/ions on EC). | Type y, then Time (h) or Potential (V). |
s |
List recently used titles for this mode and optionally reuse one. | Type s, then enter 1 to reuse the first recent title. |
m |
Show math / Greek typing help for titles (subscripts, superscripts, symbols). | Type m, then later enter a title using {sub(2)} or Greek helpers. |
q |
Leave the rename menu and return to the main contour menu. | Type q. |
Key ey — Time-axis labels
| Key | What it does | Example |
|---|---|---|
n |
Switch the EC Y readout / overlays to number of ions (prompts for mass, capacity-per-ion, start-ions). | Type n, then e.g. 4.5 26.8 0. |
t |
Switch back to time on the EC Y-axis (hours). | Type t. |
q |
Return to the main operando menu. | Type q. |
Key eg — EC grid
Toggles the grid on the EC side panel.
Key c — CIF ticks
No CIF yet:
| Key | What it does | Example |
|---|---|---|
a |
Add a CIF (or add files — follow this menu’s label). | Type a, then Li2Se.cif. |
q |
Return to the previous menu without further changes. | Type q. |
With CIF sets:
| Key | What it does | Example |
|---|---|---|
a |
Add one or more CIF files as reference tick sets. | Type a, then Li2Se.cif. |
z |
Toggle Miller-index (hkl) labels. | Type z. |
t |
Toggle CIF phase titles on/off. | Type t. |
h |
Toggle highlight so CIF ticks stay visible when overlaid on the contour. | Type h. |
p |
Toggle CIF placement above vs below the contour. | Type p. |
v |
Adjust vertical position of one CIF set (w/s or a number). |
Type v, pick set 1, then w or 0.02. |
c |
Set CIF tick colors (per set or colormap). | Type c, then color set 1 with red. |
f |
Set the CIF title font (family/size). | Type f, then change size to 10. |
r |
Rename one CIF phase label. | Type r, pick the set, enter Li$_2$Se. |
n |
Hide or show the name of one CIF set. | Type n, pick the set. |
x |
Show or hide one CIF tick set. | Type x, then the set number. |
b |
Undo the last CIF change. | Type b. |
q |
Return to the main operando menu. | Type q. |
Inside CIF f:
| Key | What it does | Example |
|---|---|---|
f |
Choose the font family (pick a list number or type a name). | Type f, then 2 or Helvetica. |
s |
Set the font size in points. | Type s, then 12. |
q |
Return to the previous menu without further changes. | Type q. |
Key pk — Peak search
| Key | What it does | Example |
|---|---|---|
1 |
Run peak find with the current settings. | Type 1. |
e |
Print an explanation of the options in this menu. | Type e. |
q |
Return to the previous menu without further changes. | Type q. |
Key u — Axis units (XRD only)
| Key | What it does | Example |
|---|---|---|
2 |
Convert the live X-axis to two-theta. | Type 2 (enter wavelength if prompted). |
q |
Leave this submenu and return one level up (or to the main menu). | Type q. |
d |
Convert the live X-axis to d-spacing. | Type d. |
b |
Return to the previous menu without further changes. | Type q. |
Keys n / p / i / e / s / b / q
| Key | What it does | Example |
|---|---|---|
n |
Toggle the crosshair helper on the figure. | Type n once to show, again to hide. |
p |
Export a reusable style file (.bps / .bpsg / .bpsh). |
Type p, choose style-only or style+geometry. |
i |
Import a saved style by picking its number from the list. | Type i, then 2. |
e |
Export the figure image (svg, png, …). | Type e, choose format and folder. |
s |
Save the session as a .pkl file. |
Type s, then confirm the name/folder. |
b |
Undo the last change stored in history. | Type b. |
q |
Leave this submenu and return one level up (or to the main menu). | Type q. |