8. Histogram Mode
Histogram mode plots one numeric column from tabular .csv or .txt data (particle-size lists, image-analysis exports, and similar). It is a fourth interactive mode alongside XY, EC/CPC, and operando.
Basic usage
With --i, batplot runs a short wizard, then opens the histogram interactive menu.
Non-interactive export (no menu):
From docs/demo_data/sizes.csv (column 2 = diameter_um):
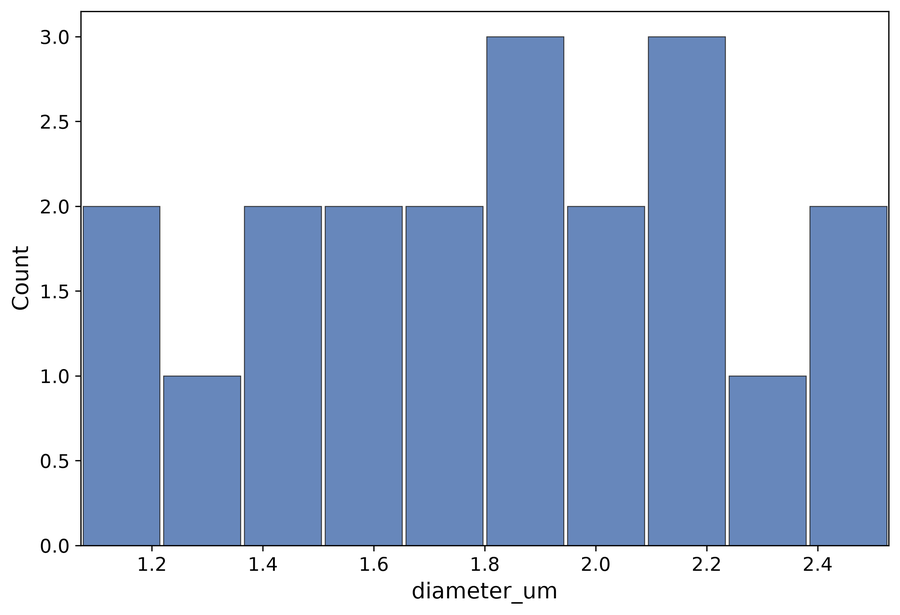
Figure: Histogram (sizes.csv, --histocol 2, --bins 10)
Preview columns first:
Mode help:
Startup wizard (--histo --i)
- Choose the column to histogram (numbered list with a short preview).
- Set the histogram range (
xmin xmax, orauto). - Set bin width, or
bins=Nfor a fixed number of equal-width bins.
Then the figure appears and the Histogram Interactive Menu is available.
Interactive menu — Histogram (every key and subkey)
Clickable interactive menu
After the wizard, the Histogram Interactive Menu opens: Styles | Geometries | Options. Style files use .bpsh (not .bps).
Key c — Colors
| Key / input | What it does | Example |
|---|---|---|
bar:color |
Set the histogram bar fill color (name or #RRGGBB). |
Type bar:steelblue or bar:#4C72B0. |
edge:color |
Set the histogram bar edge/outline color. | Type edge:black or edge:#222222. |
alpha:… |
Set bar fill transparency (0 = invisible, 1 = opaque). | Type alpha:0.7 for slightly transparent bars. |
palette / named palette |
Apply a palette when offered Use the matching single-key rows for full detail. | Type one option from palette` / named palette, for example the first key listed. |
w:color / a:color / s:color / d:color |
Spine colors Use the matching single-key rows for full detail. | Type one option from w:color/a:color/s:color/d:color, for example the first key listed. |
v |
Print the current color assignments for curves or spines. | Type v to list colors, then adjust with 1:red or s:black. |
u |
Open the saved-custom-colors helper (store/reuse hex or named colors). | Type u, save a color, then reuse it later as 1:#1f77b4. |
e |
Pick a color from the screen/eyedropper when the prompt offers it. | Type e, click a pixel on the figure, confirm the hex value. |
q |
Return to the previous menu without further changes. | Type q. |
Key f — Font
| Key | What it does | Example |
|---|---|---|
f |
Choose the font family (pick a list number or type a name). | Type f, then 2 or Helvetica. |
s |
Set the font size in points. | Type s, then 12. |
b |
Choose bold or normal font weight. | Type b, then bold. |
h |
Open text-highlight tools (colored box behind label text). | Type h, then t to turn highlight on. |
q |
Return to the previous menu without further changes. | Type q. |
Key a — Density curve
Overlays a smooth density estimate on top of the histogram bars.
| Key | What it does | Example |
|---|---|---|
t |
Turn the density-curve overlay on or off. | Type t. |
c |
Set the linewidth of the plotted data curves. | Type c, then 2. |
w |
Set linewidth for the density curve or grid (as listed). | Type w, then 1.5. |
l |
Open or apply line-style choices (solid/dashed/markers) for curves. | Type l, then ld for line+markers or da for dashed. |
a |
Set highlight transparency from 0 (invisible) to 1 (solid). | Type a, then 0.35. |
q |
Leave this submenu and return one level up (or to the main menu). | Type q. |
Inside l (line style):
| Key | What it does | Example |
|---|---|---|
s |
Use a solid linestyle for the density curve. | Type s. |
d |
Use a dashed linestyle for the density curve. | Type d. |
t |
Use a dotted linestyle for the density curve. | Type t. |
q |
Leave this submenu and return one level up (or to the main menu). | Type q. |
Y-axis mode (density vs count) is under main-menu t → h → d, not here.
Key l — Lines / grid
| Key | What it does | Example |
|---|---|---|
f |
Set linewidth of the axes frame and tick marks. | Type f, then 1.0. |
g |
Turn the plot grid on/off and adjust grid width when asked. | Type g, then follow the on/off or width prompt. |
w |
Set linewidth for the density curve or grid (as listed). | Type w, then 1.5. |
q |
Return to the previous menu without further changes. | Type q. |
Key t — Spines, ticks, and display
Spines are the four border lines of the axes box. Tick marks, tick numbers, and axis titles sit on those sides.
Press t, then type commands at the spine prompt. Most toggles are a side letter + number with no space (for example s2). You can put several codes on one line.
Step 1 — Pick a side (WASD)
| Key | What it does | Example |
|---|---|---|
w |
WASD top side of the axes box. | Type w5 to toggle the top axis title. |
a |
WASD left side of the axes box. | Type a4 to toggle left tick numbers. |
s |
WASD bottom side of the axes box. | Type s2 to toggle bottom major ticks. |
d |
WASD right side of the axes box. | Type d1 to toggle the right spine line. |
Step 2 — Pick what to show/hide on that side
| Number | What it does | Example |
|---|---|---|
1 |
Toggle the border spine line on the chosen side. | s1 toggles the bottom spine. |
2 |
Toggle major tick marks on the chosen side. | a2 toggles left major ticks. |
3 |
Toggle minor tick marks on the chosen side. | s3 toggles bottom minor ticks. |
4 |
Toggle tick number labels on the chosen side. | a4 hides or shows left numbers. |
5 |
Toggle the axis title on the chosen side. | w5 toggles the top title. |
Examples (copy these ideas)
| You type | What it does | Example |
|---|---|---|
s2 |
Toggle bottom major tick marks on the plot frame. | Type s2 once to hide bottom majors; type again to show them. |
w5 |
Toggle the top axis title visibility. | Type w5 to hide the top title if it overlaps the plot. |
a4 |
Toggle left-side tick number labels. | Type a4 to hide left numbers for a cleaner export. |
d1 |
Toggle the right spine (border) line. | Type d1 to remove the right border. |
s2 w5 a4 |
Apply several WASD toggles in one command (space-separated). | Type s2 w5 a4 to hide bottom majors, top title, and left numbers together. |
Blank line or q leaves a nested prompt; q on the spine prompt returns to the main interactive menu.
Extra commands (type the letter alone)
| Key | What it does | How to use it | Example |
|---|---|---|---|
i |
Flip tick marks to point into vs out of the plot. | Type i once; type again to flip back |
Type i once; type again to flip back. |
l |
Set major tick length (points). Minor length is set automatically to about 70% | Type l, then enter a positive number |
Type l, then 6. |
n |
Set spacing between major ticks. | Type n, then e.g. x 0.5, y 1, all 1, or x auto |
Type n, then x 0.5, all 1, or x auto. |
m |
Set how many minor ticks sit between majors. | Type m, then e.g. x 4 or all 0 (off) |
Type m, then x 4 or all 0 to disable. |
p |
Nudge axis titles away from the data. | See the next table | Type p, then w and use nudge keys. |
list |
Print the current spine/tick on/off state for every side. | Read the report, then continue | Type list. |
q |
Leave this submenu and return one level up (or to the main menu). | Back to the main interactive menu | Type q. |
Inside p — move axis titles
| Key | What it does | Example |
|---|---|---|
w |
WASD top side of the axes box. | Type w5 to toggle the top axis title. |
s |
WASD bottom side of the axes box. | Type s2 to toggle bottom major ticks. |
a |
WASD left side of the axes box. | Type a4 to toggle left tick numbers. |
d |
WASD right side of the axes box. | Type d1 to toggle the right spine line. |
r |
Reset all title-offset nudges back to the default positions. | Type r after overshooting with x 0.5 / y -0.3. |
q |
Leave this submenu and return one level up (or to the main menu). | Type q. |
Typical nudge keys after you pick a side: w/s/a/d to move, 0 to reset that title, q to go back.
Extra for histogram: h display tools
On the spine prompt you can also type h to open histogram display toggles (this is unique to histogram mode).
| Key | What it does | Example |
|---|---|---|
d |
Toggle Y-axis between density and count. | Type d to switch to density (or back to counts). |
n |
Show or hide numeric labels on bars. | Type n. |
m |
Show or hide mean and median marker lines. | Type m. |
q |
Return to the spines/ticks menu. | Type q. |
Bar fill colors and density-curve styling are separate keys (c and a on the main menu).
Key g — Size
Sizes are in inches.
| Key | What it does | Example |
|---|---|---|
p |
Resize the axes box (plot frame) in inches. | Type p, then 6 4. |
c |
Resize the whole figure window in inches. | Type c, then 8 6. |
q |
Leave this submenu and return one level up (or to the main menu). | Type q. |
After p or c, type two numbers such as 6 4, or quit with q / blank.
Key w — Bar width
Controls how wide each bar is inside its bin (not the bin edges themselves).
| What you type | What it does | Example |
|---|---|---|
| A number between 0 and 1 | Fraction of the bin width filled by the bar (e.g. 0.8). |
Type 0.8 for bars that leave a small gap. |
q / blank when allowed |
Cancel Use the matching single-key rows for full detail. | Type one option from q` / blank when allowed, for example the first key listed. |
The current value is shown in the main menu label next to w. Bin edges / count of bins are set with x.
Key r — Rename
| Key | What it does | Example |
|---|---|---|
x |
Set the histogram X-axis title (the binned quantity). | Type x, then Particle size (µm). |
y |
Set the histogram Y-axis title (count or density). | Type y, then Counts or Density. |
t |
Set the figure title above the plot. | Type t, then PSD — sample A. |
o |
Set an optional top axis label. | Type o, then n = 1200 particles. |
s |
Show recently used titles and optionally reuse one. | Type s, then enter 1. |
m |
Show math / Greek typing help for titles. | Type m, then use {sub(2)} when renaming. |
q |
Return to the main histogram menu. | Type q. |
Key x — Range / bins
Re-runs the same kind of questions as the startup wizard, so you can change the histogram without restarting.
| Step (typical) | What it does | Example |
|---|---|---|
| Display range | Set the X display window as xmin xmax, or auto. |
Type 0 10 to show 0–10, or auto for full span. |
| Binning | Set a bin width number, or bins=N for N equal bins. |
Type 0.5 for width 0.5, or bins=40. |
| Cancel | Abort the current prompt and return. | Type q when offered. |
This does not delete your raw column data; it only changes how bars are built and displayed. Bar width fraction is separate (w).
Key y — Y limits
| Key / input | What it does | Example |
|---|---|---|
min max |
Enter both limits as two numbers separated by a space. | 10 80 or 3.0 4.2. |
w / s |
Step upper / lower Use the matching single-key rows for full detail. | Type one option from w/s, for example the first key listed. |
a |
Auto-scale this axis to the visible data. | Type a after zooming too far. |
q |
Return to the previous menu without further changes. | Type q. |
Keys p / i / e / s / b / q
| Key | What it does | Example |
|---|---|---|
p |
Export a reusable style file (.bps / .bpsg / .bpsh). |
Type p, choose style-only or style+geometry. |
i |
Import a saved style by picking its number from the list. | Type i, then 2. |
e |
Export the figure image (svg, png, …). | Type e, choose format and folder. |
s |
Save the session as a .pkl file. |
Type s, then confirm the name/folder. |
b |
Undo the last change stored in history. | Type b. |
q |
Leave this submenu and return one level up (or to the main menu). | Type q. |
Batch export
Export each CSV/TXT in the folder as its own figure under Figures/. --histocol is required for --all (column number or header name):
Batch interactive editing
Edit two or more histograms together (styles sync across panels):
If --histocol is omitted, the wizard runs on the first file and the same column/bin layout is reused for the rest. See also Batch mode.
Flags (histogram)
| Flag | What it does |
|---|---|
--histo |
Launch histogram mode for the listed file(s). |
--histocol N |
Choose the numeric column (1-indexed number or header name). |
--xrange A B |
Restrict the histogram display window on X. |
--binwidth W |
Set the width of each bin. |
--bins N |
Use N equal-width bins across the range. |
--all |
Batch-export one figure per CSV/TXT (requires --histocol). |
allfiles |
Expand to every CSV/TXT in the folder. |