11. Utilities
Small CLI helpers you often use before interactive plotting. They do not replace the mode chapters.
How examples work here: every utility is shown as a terminal session — the command you type, then the text batplot prints. Interactive menu keys still use tables in the mode chapters; CLI commands always use this terminal style.
Shared demo file
--showcol, --strip-header, and --readcol below all use the same simulated file demo_cols.txt. It has:
- 2 metadata lines at the top → removed with
--strip-header - 4 data columns → listed with
--showcol - Non-default Y columns → selected with
--readcol(e.g. plotangle_degvsI_norminstead of the default first two columns)
Instrument: DemoLab
Exported: 2026-01-15
angle_deg   I_sample    I_blank I_norm
10.0    120.5   15.2    105.3
12.5    98.1    14.8    83.3
15.0    210.0   16.0    194.0
17.5    145.2   15.5    129.7
20.0    88.4    14.9    73.5
22.5    176.0   15.1    160.9
25.0    132.7   15.3    117.4
27.5    95.0    14.7    80.3
30.0    158.6   15.0    143.6
Preview columns (--showcol)
Print numbered columns, header names when found, and the first values in each column. Use this to decide --readcol (or --histocol / --readcolc / --readcols on other file types). Works for CSV, Excel, text, .mpt, .brml, Bruker .raw, and similar.
=== demo_cols.txt ===
  Leading non-data lines (not used as column names):
    (1) Instrument: DemoLab
    (2) Exported: 2026-01-15
  [1] angle_deg
      10, 12.5, 15, 17.5, 20, 22.5, 25, 27.5, 30
  [2] I_sample
      120.5, 98.1, 210, 145.2, 88.4, 176, 132.7, 95, 158.6
  [3] I_blank
      15.2, 14.8, 16, 15.5, 14.9, 15.1, 15.3, 14.7, 15
  [4] I_norm
      105.3, 83.3, 194, 129.7, 73.5, 160.9, 117.4, 80.3, 143.6
--showcol already skips the two metadata lines for previewing, but those lines can still confuse some tools and clutter the file. Next, strip them for a clean copy.
Strip header lines (--strip-header)
Copy files with the first N lines removed into a stripped/ subfolder next to each input. Originals are never modified. Binary formats (.brml, .raw, .xlsx, …) are skipped.
Remove the two metadata lines from the same demo_cols.txt:
Stripped 2 header line(s): demo_cols.txt → …/stripped/demo_cols.txt
Done: stripped headers from 1 file(s) → 'stripped/' subfolder(s).
Contents of the stripped copy (also saved in-repo as demo_cols_stripped.txt):
angle_deg   I_sample    I_blank I_norm
10.0    120.5   15.2    105.3
12.5    98.1    14.8    83.3
15.0    210.0   16.0    194.0
17.5    145.2   15.5    129.7
20.0    88.4    14.9    73.5
22.5    176.0   15.1    160.9
25.0    132.7   15.3    117.4
27.5    95.0    14.7    80.3
30.0    158.6   15.0    143.6
Preview again — no “Leading non-data lines” warning:
=== demo_cols_stripped.txt ===
  [1] angle_deg
      10, 12.5, 15, 17.5, 20, 22.5, 25, 27.5, 30
  [2] I_sample
      120.5, 98.1, 210, 145.2, 88.4, 176, 132.7, 95, 158.6
  [3] I_blank
      15.2, 14.8, 16, 15.5, 14.9, 15.1, 15.3, 14.7, 15
  [4] I_norm
      105.3, 83.3, 194, 129.7, 73.5, 160.9, 117.4, 80.3, 143.6
Folder form (same idea, many files)
Choose columns (--readcol)
Default 1D plotting uses columns 1 and 2. For a real three-column file such as TD_R02.dat, pick another Y with --readcol (see also 1D mode):
X = column 1, Y = column 3
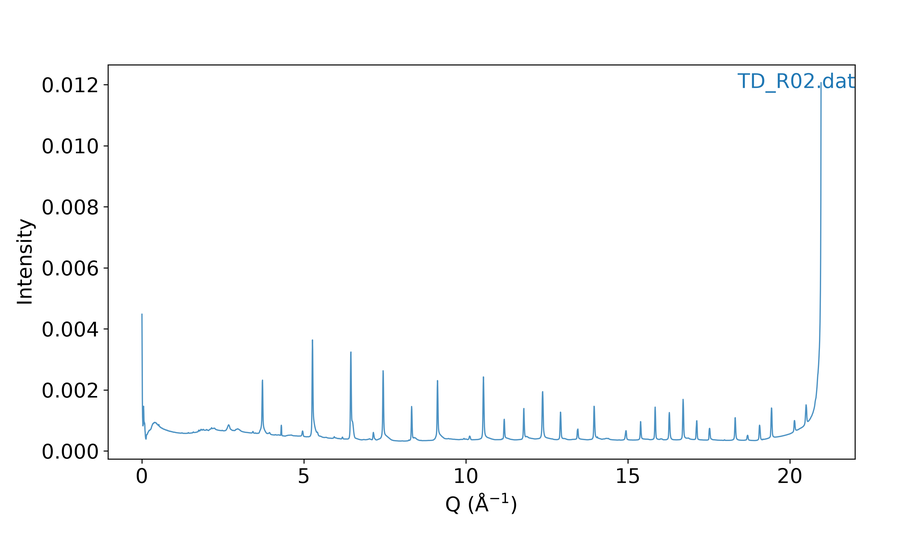
Figure: --readcol 1 3 (TD_R02.dat)
Plot both Y columns against the same X:
two curves: columns 2 and 3 vs column 1
same thing with range shorthand
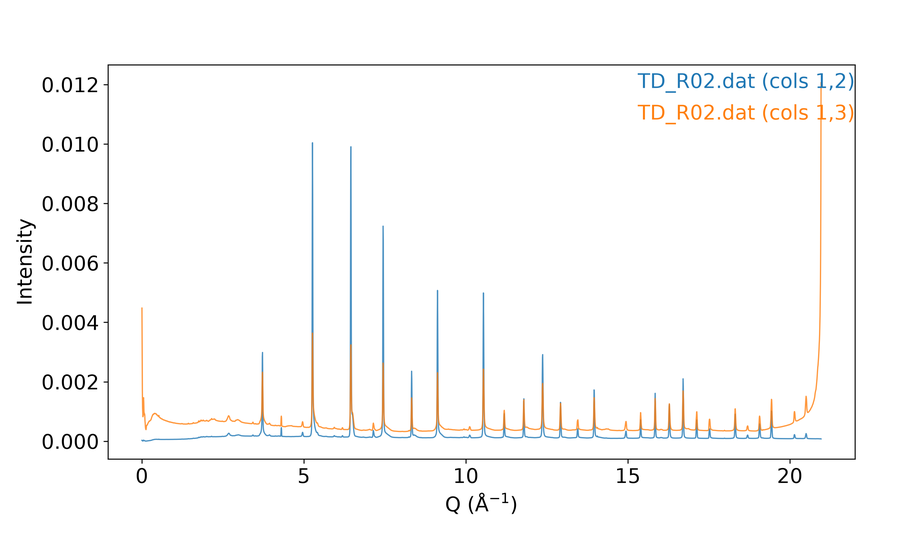
Figure: --readcol 1 2-3 (TD_R02.dat)
each file can pick its own columns
After --showcol on the shared demo_cols.txt layout above, you can likewise plot headered columns (e.g. --readcol 1 4 for angle_deg vs I_norm).
Convert XRD files (--convert)
Rewrite powder-diffraction x-axes among 2θ, Q, and d (and between two wavelengths) into a converted/ subfolder next to each input. Originals are never modified.
This is the file-export path. For on-screen conversion only, see 1D — Wavelength Handling (--wl, file:λ, interactive u).
Units and tokens
Units are case-insensitive. Aliases: q/Q, d/D, 2theta/2th/tth/two_theta.
| Token form | Meaning |
|---|---|
A number (e.g. 1.54) |
2θ at that wavelength (Å) |
q / Q |
Momentum transfer Q (Å⁻¹) |
d / D |
Interplanar spacing d (Å) |
2theta |
Explicit 2θ — pair with --wl λ when λ is not the other token |
Conversion matrix
| Command | What happens | Default output extension |
|---|---|---|
--convert 1.54 q |
2θ(λ=1.54) → Q | .qye |
--convert q 1.54 |
Q → 2θ(λ=1.54) | .xy |
--convert 1.54 0.709 |
2θ(λ₁) → Q → 2θ(λ₂) | .xy |
--convert q d / --convert d q |
Q ↔ d (no λ) | .xy |
--convert 1.54 d / --convert d 1.54 |
2θ(λ) ↔ d | .xy |
--convert 2theta q --wl 1.54 |
Same as --convert 1.54 q with named units |
.qye |
--convert q 2theta --wl 1.54 |
Same as --convert q 1.54 |
.xy |
Override the output suffix with --convert-ext (e.g. .qye, qye, .xy).
--convert needs ordinary two-column XRD (or --readcol to pick X/Y). From the manuscript demo tree, XRD/converted/R02.qye is already in Q:
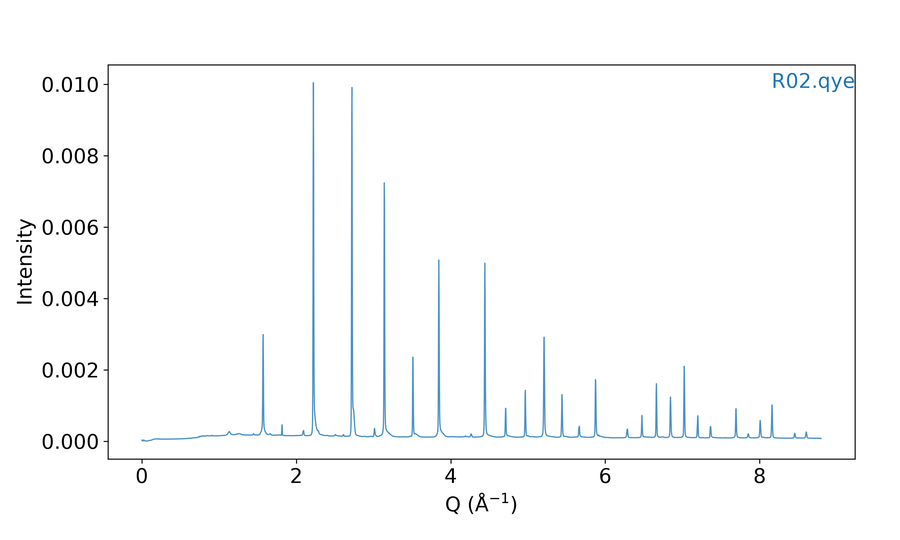
Figure: converted Q-space XRD (XRD/converted/R02.qye)
Example — 2θ (λ = 1.54 Å) → Q
Starting from a small clean.xy (2θ, intensity):
Start of converted/clean.qye:
# # Converted from clean.xy: 2θ (λ=1.54 Å) → Q
 0.355933  100.000000
 0.391501  120.000000
 0.427060  90.000000
 0.711189  200.000000
Example — re-project 2θ between two wavelengths
# # Converted from clean.xy: 2θ (λ=1.54 Å) → 2θ (λ=0.7093 Å)
 2.302346  100.000000
 2.532448  120.000000
 2.762512  90.000000
Example — Q ↔ d and Q → 2θ
Folder / many files
Convert every matching file in a folder ( --ext required for a directory):
Custom columns with --readcol
When 2θ or Q is not in columns 1–2:
Output location and headers
- Folder:
<input_dir>/converted/ - Default extensions: Q →
.qye; 2θ or d →.xy(override with--convert-ext) - Written files include a short comment header describing the conversion
- Intensity (and error column when present) is copied unchanged; only X is transformed
Plot-time wavelength suffixes (file.xye:1.54, dual :λ1:λ2, CIF :λ) are documented under 1D / XY — Wavelength Handling.
Open the manual / version / help
Opens the online user manual in your browser.
Prints the installed version and release notes.
Shows electrochemistry-specific help (xy, op, histo also work).